Crowdsourcing Lab: Oakland vs Macomb
- Player 9
- Nov 19, 2023
- 4 min read

Updated: Nov 30, 2023
Authors: Cal Terry, Maddy Aude
As life continues, transportation advances into the new age as a dependent factor in the daily lives of people everywhere. Our story made use of information gathered from the census.gov and made use of our findings in our own living spaces. The targeted areas were that of my partner, Maddy Aude's county, Macomb and that of my own, Oakland.
When it comes to jobs, especially in the U.S., it is imperative to understand what form of transportation best suits your needs. This will be determined by whether or not you stay in a busy community where cars flood the streets and highways, or by distance, whether it’s a job you’d need your own transportation, a form of transport that aids the public, or if it’s just around the corner from your home.
These are the questions my partner and I decided to go with for the Survey.
Survey questions from Google Forms:
Do you currently work from home or do you commute to work?
Do you prefer to work from home or do you prefer to work in person?
What’s your form of transportation when going to work (between driving alone, carpooling, walking, biking, public transportation, no transportation, or working from home.
The interest in this story revolves from the fact that not everyone uses transportation to go to work. There are multiple reasons why that may be so, revolving around the fact that most businesses offer this type of position towards its workings.
Considering the recent pandemic forcing some companies into telework, there have been waves of people who benefit from having to work from the comforts of their homes while others despair from it. Covid'19 shaped America and still, to this day, it continues to affect the world and the way people lived before the spread. This data was used to see what people benefit most from in either area, regardless of them working or not.
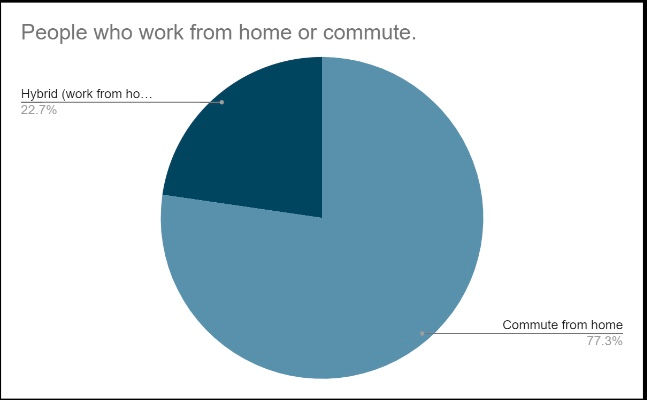
The graph that shows the amount of people who’ve answered a survey about the different forms of transportation they take to work, including those who work from home, in the county of Oakland, was our first question. 22 people were asked from both their respected areas and, as shown, between the amount of people who work from home or commute, 77.3% of people commute from home while the rest of the surveyors either worked from home and commuted in Oakland.
There was another part of that same question, asking if anyone works from home only, receiving zero votes from the people who were asked. Stores that were affected by covid-19, mainly those in retail, had to close down their locations to prevent spread, but that doesn’t entirely mean that every corporation abides by this fact.

The next graph shows people of Oakland county who had preferences as to wanting to work in person versus online. The options varied, showing that the most common responses being all in person and mostly in person. The third most popular response was the preference of half in person, half online type of work space, or hybrid.
Most corporations such as mortgage firms and at this point of time, educational institutions happen to have you work either in person or online, sometimes for the better, seeing how transportation isn’t exclusive to everyone and working online could help get things done faster at a more efficient pace for deadlines, however, this could prove to have the opposite effect, seeing how some companies had to deal with low staff shortages as well as mental health challenges.
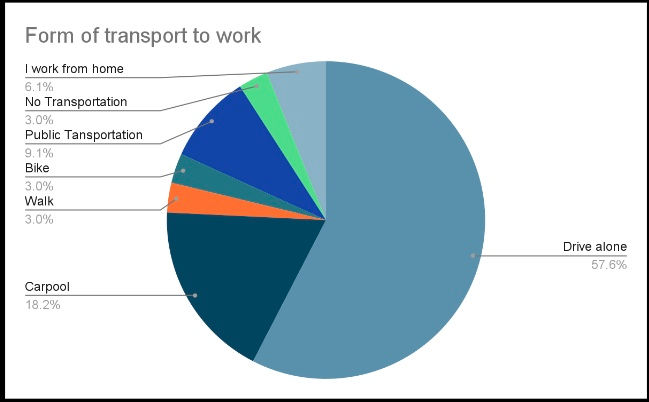
Finally, the last question determined the form of transportation when heading to work. Surprisingly, the responses varied, meaning some surveyors took it upon themselves to answer more than one method, the most common being those who drive alone and those who carpool. As expected in this day and age, not too many people bike nor do they walk.
The statements received from friends and family members helped us gain more insight onto the rising question of how areas differ from one another as far as transportation goes. It was very interesting to note that although there were a lot of similarities between and every one who took the survey, it’s good to find out that everyone has their own way of getting around, whether it inconveniences them or helps them, whatsoever.
Crowdsourcing aided us well through this assignment, seeing how easy it is to gather data through people by simply walking up and asking them for a moment of their time. The Census.gov also provided us with a great tool when it came to figuring out what data we can apply to our research. Was quite hard for me since I keep somewhat of a private social media on deck but it really broke me out of my comfort zone to even go up and ask. This tool will definitely prove to be useful for future posts.
What I took away from this survey was the ability to gain information about this topic using a faster and much more efficient method. Bing able to gain insight from other people in a matter of moments without having to go out of your way to see them made this assignment a tad bit enjoyable than others. Seeing their responses as well also made it worthwhile and I'm looking forward to applying this method on the multimedia Package.
Survey link: Crowdsourcing survey
Partner's site: Maddy's website


Comments